
Description
MaxTM by HornetMax
MaxTM is a telemetry tool made by HornetMax. It wont be usefull for many players, but for very few it is very useful!
If you are a bike modder and want to take a deep dive into the physics / handling of your mod, or your a player who wants to go more indepth on making a setup for a bike, or you just like to work with telemetry then this is perfect for you, if you are neither of the just mentioned ‘persons’, it might not be great for you.
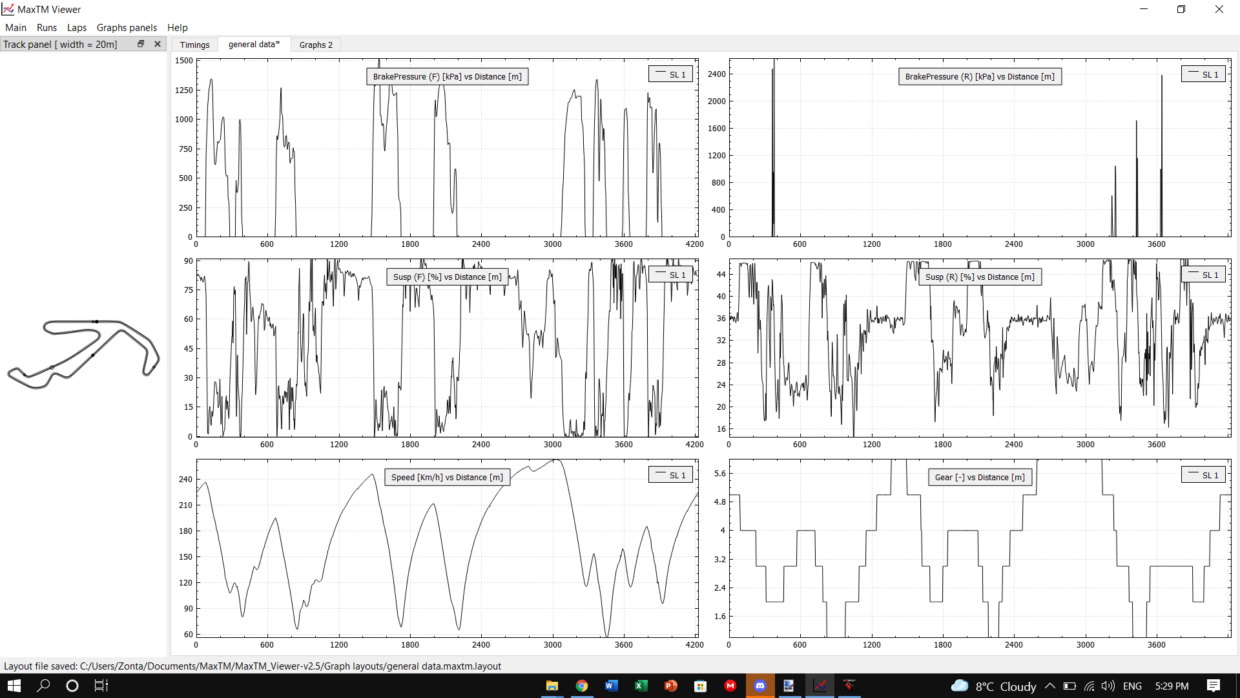
Explanation; in the thumbnail you see 6 different graphs, with 6 different types of data.
Top left > front brake pressure in kPa, top right > rear brake pressure in kPa, middle left > front suspension travel in %’s, middle right > rear suspension travel in %’s, bottom left > speed in Km/h, bottom right > gear used over the track.
There are many more things you can show, both on a different page, or add more rows / columns (I added an extra row now, as normally its 2×2 and on the screenshot it is 3×2)
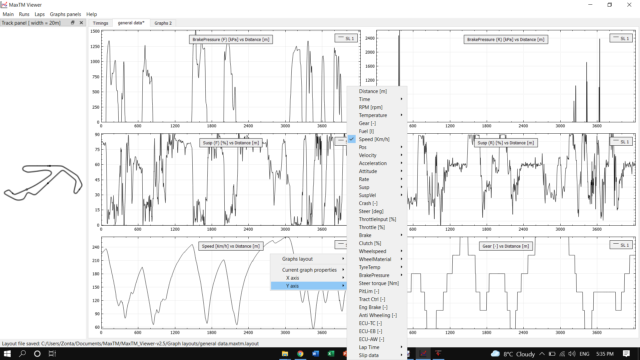
In the second picture you can see all the categories you can choose off, and the ones which show a > at the end of the name have multiple sub categories, so plenty data to show!
———————————————————
USAGE:
I’ll briefly describe the main features here: there is no user manual yet (and maybe there will never be one), but the viewer is not too complicate.
- The main areas of the main window have tooltips (i.e. little text explanations that appear when you leave the mouse still on them for a while): READ THEM.
- The main areas of the main window have tooltips (i.e. little text explanations that appear when you leave the mouse still on them for a while): READ THEM (intentional repetition)
- Seriously, read the tooltips: in particular the ones of the graphs and track map, as they explain how to interact with the graphs using the mouse. I could resume the thing here, but if I do it then you won’t read the freakin’ tooltips, so I won’t do it

- On most areas a context menu is available: just right-click with the mouse.
- The worst thing you could do with the viewer is delete some telemetry file: it’s not a dangerous app, don’t be afraid to try things around.
- The general idea is:
- You can open an arbitrary number of telemetry files at the same time. Each telemetry file will appear as a Run containing some Laps.
- On the left you have the Runs/Laps as seen via the telemetry data, along with their lap times (as seen by the telemetry).
- On the right (in the panel named Timings you have the same Runs and more or less the same Laps, with more or less the same lap times (as seen by GPB/MXB/WRS/KRP) and their split times.
- Telemetry lap times come in two flavours: column “Lap Time” is based on GPB/MXB/WRS/KRP timing, column “Lap Time (w)” is based on an external timer which turns out to be more precise (I think it’s some sort of bug, but I have no feedback on it from Piboso).
- The telemetry lap times should more or less match the “official” lap times (the one in the Timings panel). Small errors are normal (up to 0.1-0.2 sec I’d say), larger ones are not.
- The number of laps between the Runs/Laps panel and the Timings panel may not be identical: typically due to not completed laps, out of pits laps and so on. It’s not too hard to see which lap in Runs/Laps corresponds to which lap in Timings.
- In Runs/Laps you can select up to 4 laps (each one has a specific color): the 1st lap you you select will be the reference lap.
- On the right you have (by default) one Graphs panel: here you can have the telemetry data plotted. You can have multiple graphs panels.
- In each graphs panel, using the context menu (right-click), you can:
- customize the number of graphs (as an N by M grid) and their appearance (axis labels, tick labels).
- customize the each individual graph: delta plot (see later on), join/mark data points, show/position the legend etc.
- customize what to plot on each graph on the X and Y axes (the variable on the X axis is the same for all the graphs in the panel)
- Save the current layout of the graphs panel, so that you can reload it next time.
- Delta graphs: a delta graph is simply a graph where instead of plotting (let’s say) the speed against the position on the track (centerline) of the selected laps, you plot the difference in speed between the 1st selected lap (the reference lap) and the other selected laps. So if you have 4 selecte dlaps, on a normal plot you’ll have 4 lines while on a delta plot you’ll have 3 lines, each of them being the speed difference between selected lap 1 and selected laps 2, 3 and 4.
- The viewer app comes with 2 themes: the default “bright” one (almost white background) and a darker one I find very handy at night (did I told you I average 4-5hrs of sleep per day ?).^^^ Above is the explanation made by HornetMax about MaxTM, copy pasted from the forum.
